How to Measure Visual Content Performance for Dental Clinics
Visual content performance measures how images, videos and infographics drive audience attention, engagement and patient actions for healthcare practices. Measuring visual content works by capturing interaction signals (views, clicks, watch time) and linking them to downstream outcomes such as appointment bookings, enquiries and reputation signals. For clinics this matters because patient trust, local discovery and conversion all hinge on how prospective patients perceive visual assets, making measurement a practical route to improving patient acquisition. This guide explains the most relevant visual content KPIs for dental practices, the tools and platforms to track them, and step-by-step optimisation and attribution methods tailored to healthcare compliance and local search. You will find concise KPI definitions, tool comparisons, optimisation checklists, worked ROI examples and anonymised Australian case study takeaways. Throughout, we integrate semantic tactics for datasets, explain GA4 and Google Business Profile implications, and offer practical monitoring cadences so clinics can act on evidence rather than guesswork.
What Are the Key Visual Content Performance Metrics for Dentists?
Key visual content performance metrics quantify how images and videos attract attention, prompt actions and support patient decisions for dental clinics. These metrics work by measuring different parts of the user journey — exposure (reach, impressions), attention (watch time, time on page), engagement (likes, shares, CTR) and outcomes (conversion rate, appointment bookings); together they show whether visuals are persuasive and discoverable. Tracking these KPIs helps clinics prioritise content formats that build trust, improve local visibility and increase bookings. Below are essential metrics with concise definitions, calculations and why each matters for dental patient acquisition.
Visual content KPIs for dentists include core exposure, engagement and conversion signals:
- Engagement rate: Total engagements divided by impressions or followers, expressed as a percentage; it shows content resonance with your audience.
- Click-through rate (CTR): Clicks on a visual link divided by impressions; it indicates how effectively a visual drives visits to a booking page.
- Conversion rate: Bookings or form submissions divided by visits or clicks tied to the visual; it measures actual patient action taken.
- Reach and impressions: Unique users reached versus total views; these metrics signal awareness and frequency of exposure.
- Watch time / time on page: Aggregate viewing time for videos and dwell time for pages with visuals; they reflect user interest and algorithmic favour.
The next subsection breaks down how engagement rate is measured specifically for dental visual assets and practical benchmarks.
How Is Engagement Rate Measured for Dental Visual Content?
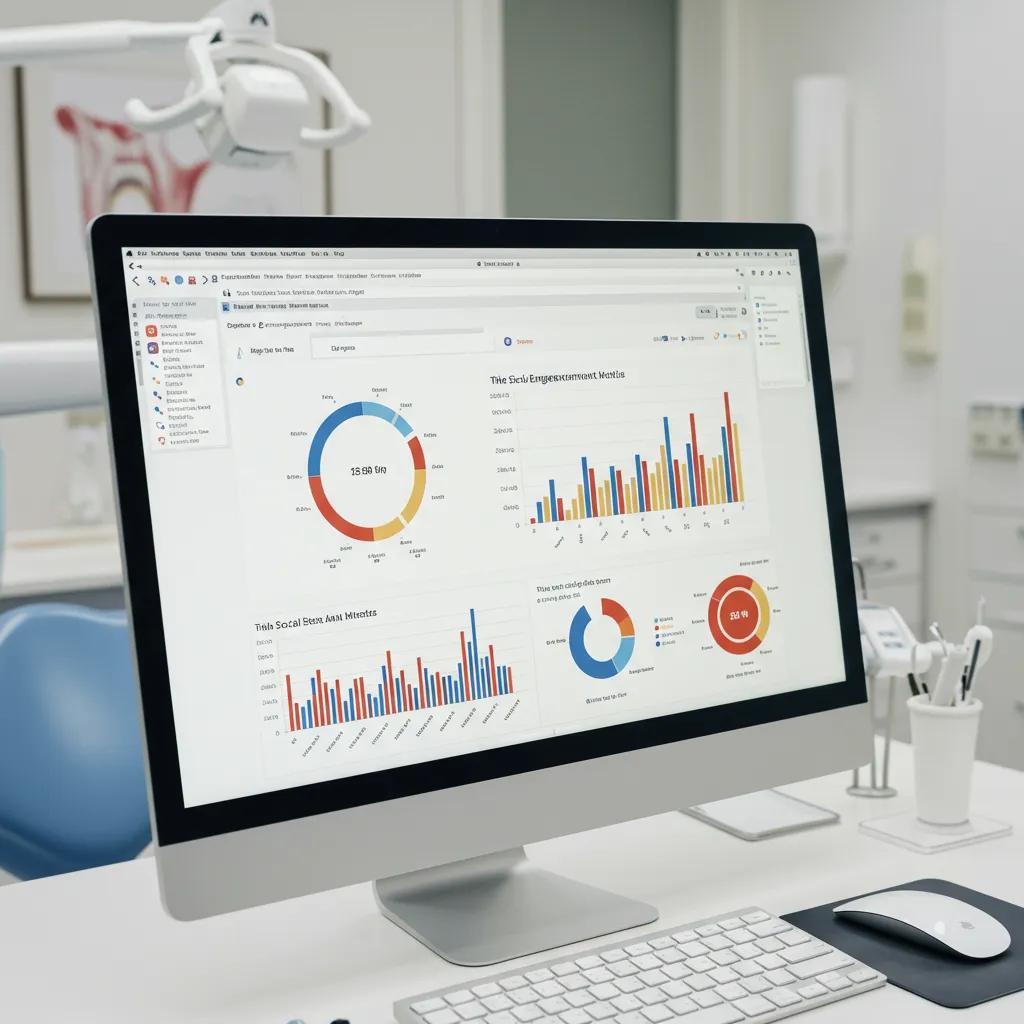
Engagement rate measures interactions (likes, comments, shares, saves) relative to exposure and signals content relevance to patients. Calculate engagement rate commonly as (total engagements ÷ impressions) × 100, or as (total engagements ÷ followers) × 100 for audience-relative benchmarking; both reveal different insights for paid or organic campaigns. For dental visuals, high engagement often correlates with perceived trustworthiness — testimonial videos and before-and-after images typically drive above-average engagement when patient consent and clinical accuracy are clear. Clinics should watch trends rather than single-post spikes and segment engagement by content type to prioritise formats that both educate and convert.
If engagement is low, test thumbnail variations and CTAs; the following subsection explains how CTR complements engagement by measuring action intent.
What Does Click-Through Rate Reveal About Visual Content Effectiveness?
Click-through rate reveals how well a visual motivates viewers to take the next step, such as visiting a booking page or reading patient education content. CTR is calculated as (clicks ÷ impressions) × 100 and varies by platform: thumbnails and cover images influence CTR heavily on social and SERP results while inline images affect CTR on site pages. For dentists, a strong CTR on testimonial or FAQ videos indicates that visuals are both attention-grabbing and aligned with patient intent; low CTR despite high engagement suggests the CTA or landing page needs improvement. Use UTM parameters to separate visual-driven CTR from other campaign sources and validate where users go after clicking.
Tracking conversions closes the measurement loop; the following subsection explains attributing bookings to testimonial visuals.
How to Track Conversion Rates from Visual Patient Testimonials?

Conversion rate attribution links testimonial views or clicks to appointments and requires deliberate tracking to avoid misattribution. Implement unique UTM parameters, dedicated landing pages or booking links on testimonial posts, and set conversion events in analytics to capture completed bookings or enquiry form submissions. For healthcare practices, multi-touch attribution is useful because prospective patients often view a testimonial, check the GBP listing and then call; combining UTM data with CRM or call-tracking reconciles these paths. Define conversion windows (e.g., 7–30 days) consistent with typical patient decision timelines to measure realistic conversion rates.
Understanding exposure helps decide whether to prioritise awareness or frequency; the next subsection clarifies reach versus impressions for dental visuals.
Why Are Reach and Impressions Important for Dental Visuals?
Reach counts unique users who saw the visual while impressions count total views; both matter for awareness and frequency planning. Reach is critical when launching new services to maximise the number of local potential patients who see the visual once, whereas impressions help diagnose whether repeated exposure is building familiarity or causing fatigue. For local dental campaigns, aim for a balance where reach introduces the clinic to new audiences and a controlled frequency via impressions reinforces trust without oversaturating the same users. Frequency capping and segmented audiences help manage exposure to optimise both reach and conversion outcomes.
Watch time and dwell metrics complete the attention picture; the next subsection explores their relationship with algorithms and conversions.
How Does Watch Time and Time on Page Impact Visual Content Success?
Watch time for videos and time on page for pages with embedded visuals are behavioural signals that show whether content holds attention and signals value to search and social algorithms. Platforms often promote content with higher watch time and completion rates, so a video that retains viewers to the end can gain broader organic distribution. For dental content, early hooks, concise messaging and captions increase completion and dwell time; improved watch time typically correlates with higher conversion propensity because prospective patients consume more of the message before acting. Use video progress events in analytics to identify drop-off points and iterate on the first 5–15 seconds to reduce abandonment.
| Metric | Calculation | Why It Matters |
|---|---|---|
| Engagement Rate | (Likes+Comments+Shares ÷ Impressions) × 100 | Measures resonance and social proof for patient-facing visuals |
| Click-Through Rate (CTR) | (Clicks ÷ Impressions) × 100 | Indicates ability of a visual to drive site visits or bookings |
| Conversion Rate | (Bookings ÷ Clicks) × 100 | Quantifies patient actions tied to visual campaigns |
| Watch Time / Time on Page | Aggregate minutes viewed ÷ Views | Signals attention and improves distribution potential |
| Reach vs Impressions | Unique users reached / Total views | Balances awareness with frequency to avoid saturation |
This table clarifies measurement formulas so clinics can implement consistent KPI tracking and compare channels.
Which Tools and Platforms Are Best for Tracking Visual Content Performance?
Selecting the right tools ensures accurate capture of visual interaction signals and their linkage to patient outcomes; tools vary by the environment they measure and the insights they provide. Google Analytics 4 (GA4) excels at site behaviour and custom event tracking for embedded visuals, native social platform insights reveal platform-specific engagement and completion metrics, and Google Business Profile insights surface how listing photos and videos drive local discovery. Heatmaps and session recordings expose on-page visual attention while A/B testing platforms validate creative improvements. Combining these tools creates a layered measurement stack that captures exposure, attention and conversion across the patient journey.
Below is a quick tool-by-use-case list to guide tool choice and prioritisation.
- Google Analytics 4 for event-based tracking and funnels.
- Native social insights (Instagram, Facebook, TikTok) for platform KPIs.
- Google Business Profile insights for local listing visual performance.
- Heatmap tools (session recordings, click maps) for on-page attention signals.
- A/B testing platforms to validate visual hypotheses and lift.
These tools complement one another; GA4 captures site-level conversions while social insights indicate platform-driven demand and heatmaps show on-page behaviour. The next subsection outlines steps to set up GA4 for visual tracking.
How to Use Google Analytics 4 for Monitoring Website Visuals?
GA4 measures visuals using event-based tracking that records interactions like video_start, video_progress, image_click and click_to_book; these events are tied to conversion events and funnels. Implement dataLayer pushes or use a tag manager to standardise naming conventions such as visual_video_start, visual_video_25, visual_image_click and visual_booking_complete to keep analyses consistent. Use UTMs on social and GBP links so GA4 can attribute visits to specific visual campaigns and build funnels from visual interaction to booking. Regularly review event counts, user paths and funnel drop-off to identify which visuals drive bookings and where users disengage.
Implementing GA4 can be technical; Milkcan Marketing supports clinics with GA4 setup and Google Business Profile insights configuration to ensure visual events and local metrics are captured correctly. Their local SEO and Google Business Profile management expertise helps align site tagging with local discovery goals.
| Tool | What It Measures | Typical Use Case |
|---|---|---|
| Google Analytics 4 | Site events, funnels, conversions | Tracking embedded video progress and booking attributions |
| Native Social Insights | Impressions, engagement, watch time, saves | Comparing platform creative performance and audience response |
| Google Business Profile Insights | Photo views, listing actions, direction requests | Measuring local listing visual impact on discovery and calls |
| Heatmap Tools (e.g., session recordings) | Click maps, scroll depth, attention hotspots | Diagnosing CTA blindness and on-page visual layout issues |
| A/B Testing Platforms | Conversion lift by variant | Validating thumbnails, CTAs and image subjects for bookings |
This comparison helps clinics pick tools based on which part of the funnel they need to measure; next we cover social metrics and GBP specifics.
What Social Media Insights Help Measure Dental Visual Content?
Social platforms provide metrics such as reach, impressions, likes, comments, shares, saves, watch time and completion rate that are specific to each channel’s algorithm and audience behaviour. Instagram and Facebook detail saves and shares for static images while short-video platforms highlight view-through rates and completion percentages that directly influence recommendation engines. Export platform-level reports regularly and normalise metrics (e.g., engagement rate per impression) to compare across channels. Prioritise platform KPIs aligned with campaign goals — awareness campaigns use reach, consideration uses watch time and saves, and conversion-focused ads emphasise CTR and landing page conversions.
Correlating social insights with site behaviour requires UTMs and cross-channel reporting; the following subsection explains Google Business Profile visual metrics.
How Can Google Business Profile Insights Improve Local Visual Content Tracking?
Google Business Profile (GBP) insights show photo views, photo quantity, and actions taken after viewing a listing, providing direct signals about how listing visuals affect local discovery. Track photo views per week, actions from photos (click to website, direction requests, phone calls) and relative photo engagement compared to category averages where available. Optimise GBP visuals with descriptive filenames, locality in captions and regular uploads to increase listing freshness and views. Monitoring these metrics highlights whether GBP photos and videos contribute to local traffic and appointment conversions.
Heatmaps and testing complement these insights; the next subsection examines on-page attention tools.
What Role Do Heatmap and Eye-Tracking Tools Play in Visual Content Analysis?
Heatmaps and session recordings reveal where users look, click and scroll on clinic pages, exposing visual bottlenecks like CTA blindness or truncated images that reduce conversion. Eye-tracking and attention heatmaps identify elements that attract attention and those ignored; combining heatmap data with conversion funnels shows whether attention aligns with conversion paths. Use heatmaps to test page layouts, image placement and CTA prominence, then run A/B tests to validate hypotheses. High-value pages (booking pages, service pages) benefit most from this analysis.
How Does A/B Testing Enhance Visual Content Performance?
A/B testing validates which visual variants actually move KPIs rather than relying on assumptions, testing thumbnails, hero images, CTA copy, image subjects (staff vs patient) and layout. Formulate hypotheses like “A patient testimonial thumbnail will increase CTR by 10%”, run tests with adequate sample sizes, and measure lift in CTR and conversion rate rather than superficial engagement. Maintain significance thresholds and run tests for the appropriate traffic window to avoid false positives. Use A/B results to iterate creative libraries and scale winning variants across channels.
How Can Dental Practices Optimise Visual Content for Better Patient Engagement?
Optimising visual content aligns creative decisions to patient needs, platform norms and local search behaviour so visuals both inform and convert. Best practices include crafting immediate hooks for videos, simplifying clinical explanations in infographics, optimising images for local SEO with ALT text and filenames, and testing visual elements with A/B experiments. These tactics reduce friction in the patient journey and leverage visuals for both education and trust-building. The subsections below provide actionable guidance for videos, infographics, image SEO and testing.
Start with video production best practices, which directly improve watch time and conversions.
What Are Best Practices for Creating Engaging Dental Videos?
Effective dental videos hook viewers in the first three seconds, present a clear educational or social-proof message, include captions for sound-off viewing and end with a concise CTA directing viewers to book or learn more. Keep platform formats in mind: short-form (under 60 seconds) for Reels/TikTok and slightly longer explainer or testimonial videos on site or YouTube. Always secure documented patient consent for testimonials and ensure clinical claims comply with local regulations. Iterate using watch time and completion metrics to refine length and structure.
How to Design Effective Infographics for Patient Education?
Infographics should present one key message per graphic, use clear hierarchy (headline, short body text, visual cues), maintain high contrast and accessible fonts, and include ALT text and a concise CTA. Simplify clinical steps into numbered sequences and validate medical accuracy with clinicians to preserve trust and compliance. Optimise dimensions and file sizes for fast loading and shareability across social channels. Test variations of the same infographic to see which messaging drives the most shares and site visits.
Why Is Image Optimisation Crucial for Local SEO in Healthcare?
Image optimisation improves page speed, accessibility and semantic relevance for local searches by using descriptive filenames, ALT text with locality modifiers (e.g., “dentist-brisbane-implant-before-after.jpg”), structured data where appropriate and properly compressed formats. Optimised images contribute to a better mobile experience, reducing bounce rate and increasing time on page — signals that can indirectly support local ranking. Regularly refresh GBP photos and ensure images on service pages align with structured data and localised content. These technical steps increase the probability that visuals support both discovery and conversion.
How to Use A/B Testing to Improve Visual Elements in Dental Marketing?
Select elements to test based on hypotheses tied to bookings or CTR — for example, hero image subject (dentist vs patient), CTA phrasing (“Book a consult” vs “Check availability”), or thumbnail designs for testimonial videos. Run tests with sufficient traffic, measure primary outcomes like booking conversion rate and secondary outcomes like CTR or watch time, and apply winners across similar pages and channels. Document results and run follow-up tests to refine improvements and avoid local opt-out biases.
How to Calculate the ROI of Visual Content in Healthcare Marketing?
Calculating ROI for visual content requires linking costs to measurable conversions and considering lifetime patient value where applicable; this makes investment decisions evidence-based. ROI is commonly calculated as (Net Revenue from campaign ÷ Campaign Cost) × 100, where campaign revenue is derived from tracked bookings attributed to the visual content. Use attribution windows, multi-touch models and average treatment value to estimate revenue per conversion. The subsections below cover practical attribution tactics, cost-benefit analysis by format and how visuals contribute to long-term trust and patient lifetime value.
First, set up reliable attribution so conversions are credibly tied to visuals.
How to Attribute Patient Inquiries to Specific Visual Content Campaigns?
Attribution uses UTMs, unique landing pages, phone number tracking and CRM integration to link inquiries and bookings to specific visual campaigns. Implement distinct UTM parameters for each visual placement, use dedicated booking links or landing pages, and employ call-tracking numbers for offline conversions; feed these signals into the clinic CRM to reconcile leads with outcomes. Where possible, adopt multi-touch attribution in analytics to recognise all interactions that contributed to a booking, not just the last click. Proper attribution enables accurate conversion valuation and ROI calculation.
Next, compare costs and returns across common visual campaign types.
What Is the Cost-Benefit Analysis of Visual Content for Dental Practices?
Cost-benefit analysis compares production and promotion costs against expected conversions and lifetime patient value to assess payback periods. Typical cost categories include creative production (video shoot, editing), platform promotion (paid social), and ongoing optimisation (A/B tests, management). Short testimonial videos often have faster payback due to high trust signals, while long educational series may require more upfront investment but generate sustained organic traffic. Amortise production costs across expected content lifespan (e.g., 12–24 months) to compute per-month cost and compare against incremental bookings attributable to the content.
| Campaign Type | Cost / Conversions | ROI Formula Example |
|---|---|---|
| Testimonial video | Production $1,500; 30 bookings over 12 months | ROI = ((30 × $150 average treatment) – 1500) ÷ 1500 × 100 |
| Educational infographic series | Production $600; 10 bookings over 12 months | ROI = ((10 × $150) – 600) ÷ 600 × 100 |
| GBP photo refresh campaign | Production $200; 8 bookings from listing | ROI = ((8 × $150) – 200) ÷ 200 × 100 |
This table gives clinics simple worked examples to model returns using average treatment values and observed conversions.
Visual content also builds long-term brand trust; the next subsection explains how to measure that qualitative lift.
How Does Visual Content Build Long-Term Brand Trust and Reputation?
Visuals such as patient testimonials and consistent clinic imagery create social proof that manifests in increased review volume, higher conversion rates and better patient retention over time. Track reputation metrics like review count, average rating and GBP engagement to quantify reputation lift. Consistent visual identity reduces friction in the patient decision process and can lift lifetime patient value by increasing repeat visits and referrals. When measuring ROI, include these softer impacts through LTV adjustments and by monitoring cohorts of patients acquired through visual campaigns over 12–24 months.
Milkcan Marketing can provide anonymised ROI modelling and a free audit to estimate likely returns from content marketing and reputation management investments for clinics that need help with setup and measurement.
What Are Real-World Examples of Visual Content Success in Australian Dental Practices?
Anonymised case studies help clinics see which visual strategies produced measurable outcomes and which metrics to prioritise. Real-world examples typically show improvements across GBP views, site CTR and booking conversions after combined visual refresh, short video campaigns and local optimisation. The narratives below summarise campaign components, metrics improved and practical takeaways that other practices can replicate at scale.
How Did a Sydney Dental Clinic Boost Bookings Using Video Content?
An anonymised Sydney clinic produced a short testimonial and an educational video sequence, optimised thumbnails and used UTMs to track clicks to a dedicated booking page. Over three months the testimonial achieved high watch-through rates, a 12% CTR to bookings and a 22% uplift in enquiries compared to the previous quarter. The campaign’s success came from early hooks, clear CTAs and consistent follow-up in their CRM. Key takeaway: combine short-form social distribution with a dedicated landing page to convert attention into appointments.
What Visual Content Strategies Increased Online Visibility for Dental Practices?
Anonymised multi-location practices refreshed gallery images across service pages and GBP listings, added localised ALT text and rolled out short explainer videos for high-value procedures. Combined with local SEO adjustments, GBP photo views increased and organic local traffic rose by a measurable margin, resulting in more calls and direction requests from nearby patients. Cross-channel alignment ensured visuals reinforced the same messaging across discovery points. Practically, coordinate GBP images, site visuals and social thumbnails to create a coherent local impression.
How Has Reputation Management Improved Through Visual Content Measurement?
A practice used before-and-after galleries and invited satisfied patients to record short testimonials, then monitored correlation between visual posts and review prompts. Visual-led posts increased review submission rates following visits, and the practice saw higher GBP engagement and a modest rise in average rating over six months. Measurement tracked review volume spikes after visual campaigns and correlated them with booking trends. The takeaway: visuals can amplify reputation outreach and make review requests more compelling when paired with an easy follow-up process.
What Are Common Questions About Measuring Visual Content Performance?
Short, direct answers help clinics quickly understand impact and next steps for visual measurement. The following Q&A addresses effectiveness, patient preference and the measurable impact of visuals in dental marketing.
How Effective Is Visual Content in Healthcare Marketing?
Visual content is highly effective in healthcare marketing because it conveys clinical outcomes and human stories quickly, which aids patient understanding and trust. Current research and platform trends in 2024 indicate higher engagement and conversion rates for video and image-led campaigns compared with text-only approaches. For clinics, visuals accelerate decision-making by simplifying complex procedures and demonstrating real results. Track watch time, CTR and conversion metrics to translate effectiveness into actionable investments.
Digital Engagement and Patient Acquisition in Dental Clinics: Insights from Dentists in the UAE
Social media has become an essential communication and marketing tool in contemporary healthcare. For dental practices, these platforms not only enhance visibility but also cultivate trust, convey expertise, and influence patient decision-making. This study investigates how social media marketing improves patient flow in dental clinics situated in Abu Dhabi, Dubai, and Sharjah. Employing a qualitative methodology, the study involved in-depth interviews with ten dentists who actively utilise digital platforms for professional purposes. Through thematic analysis, five core themes emerged: trust building and credibility, content strategies for engagement, platform selection, barriers to digital marketing, and the evaluation of marketing performance. The findings indicate that while social media enhances outreach and relationship building, challenges persist, particularly concerning time constraints, content saturation, and a lack of data-driven decision-making tools. Utilising Social Exchange Theory (SET) and the Technology Acceptance Model (TAM) as interpretive frameworks, this research offers theoretical insight and practical recommendations for optimising digital dental marketing strategies within the UAE. The study contributes novel knowledge to the field of healthcare marketing and provides evidence-based guidance for dentists seeking to adapt to the demands of a competitive, digitally driven market.
Digital Engagement and Patient Acquisition in Dental Clinics: Insights from UAE Dentists, 2025
How Many Patients Prefer Visuals Over Text in Dental Marketing?
Many prospective patients prefer visual explanations for procedures and outcomes because images and short videos reduce uncertainty and clarify expectations. Benchmarks vary by demographic and channel, but a practical approach is to allocate a majority of consumer-facing content to visuals while retaining concise text for SEO and compliance. Monitor engagement and conversion differences to decide the optimal mix for your practice.
What Impact Does Visual Content Have on Marketing Performance?
Visual content typically increases engagement, CTR and conversion when optimised for platform and patient intent; it also supports reputation by producing shareable social proof. Key metrics to watch are engagement rate, watch time, CTR and conversion rate, and improvements in these metrics generally precede increases in bookings and patient inquiries. Use coordinated measurement to link visual interactions to downstream outcomes.
How Powerful Is Visual Content in a Dental Marketing Strategy?
Visual content is powerful across the funnel: it drives awareness through GBP and social exposure, supports consideration with educational videos and testimonials, and boosts conversion with clear CTAs and optimised landing pages. The strategic value lies in making clinical quality visible and reducing the perceived risk of procedures. Prioritise visuals where they most influence patient decisions and measure their impact through conversion attribution and reputation metrics.
How to Continuously Monitor and Improve Visual Content Performance?
Ongoing monitoring requires a reporting cadence, content audits and iterative testing so visuals remain fresh, compliant and performance-driven. Establish monthly and quarterly reviews that combine platform insights, GA4 event data, GBP metrics and heatmap observations to spot trends and prioritise optimisation tasks. The process includes KPI tracking, content pruning, A/B testing and incorporating patient feedback and sentiment data into visual updates. The subsections below provide a KPI checklist, reporting guidance, audit steps and ways to use patient feedback.
What KPIs Should Dental Practices Track for Visual Content?
Map KPIs to funnel stages to maintain focus: awareness (reach, GBP photo views, impressions), consideration (engagement rate, watch time, saves), and conversion (CTR, conversion rate, bookings). Track secondary KPIs such as bounce rate, time on page and review volume that indicate experience and reputation. Set monthly targets and quarterly trend reviews to determine whether visuals support acquisition goals. Prioritise metrics that tie directly to bookings to keep measurement actionable.
How to Use Analytics Tools for Monthly and Quarterly Performance Reviews?
Use a simple reporting cadence: monthly operational reports for channel-level metrics and quarterly strategic reviews for attribution, ROI and content roadmap decisions. Monthly reports should include impressions, engagement rate, CTR and conversions for each visual campaign; quarterly reviews should combine GA4 funnels, GBP insights and heatmaps to recommend creative and technical changes. Translate data into prioritised optimisation tasks and A/B test plans to close the loop between insights and action.
Why Is Content Auditing Important for Visual Content Success?
Auditing identifies underperforming or outdated visuals, checks compliance and ensures consistency across site, GBP and social channels. An audit checklist should include freshness (upload date), performance (views, CTR, conversions), compliance (consent documentation), and technical status (file size, ALT text, filenames). Prune low-performing assets and refresh high-value visuals with new thumbnails, captions or formats to sustain performance. Regular audits prevent drift and preserve the effectiveness of visual libraries.
How to Leverage Patient Feedback and Sentiment Analysis?
Collect feedback via post-visit surveys, review prompts and social comments, then analyse sentiment and themes related to visuals (clarity, trust, perceived outcomes). Use sentiment signals to adjust messaging, select new testimonial subjects and refine educational content. Incorporate feedback into A/B test hypotheses and content updates to ensure visuals meet patient expectations and improve conversions over time.
How Does Visual Content Measurement Integrate with Local SEO and Google Business Profile?
Integration with local SEO and Google Business Profile connects visual performance to discovery and booking outcomes in local markets. Visual metrics can influence local relevance signals through increased listing interactions and engagement, and optimised images support on-page relevance for local queries. The subsections below describe how visuals can affect local rankings, list GBP-specific metrics to monitor and provide a checklist for optimising visuals on local listings and landing pages.
First, understand how visuals influence local search signals.
How Does Visual Content Influence Local Search Rankings for Dentists?
Visuals can indirectly influence local rankings by increasing listing interactions, click-throughs to local landing pages and time on page — behavioural signals search algorithms may use to infer relevance. GBP photo views and engagement suggest to search systems that the listing is active and valuable to users in the area. Optimise images with locality terms, timely uploads and captions that match local search intent to boost discoverability. Coordinating site images and GBP visuals ensures consistent signals for local relevance.
What Visual Content Metrics Are Available in Google Business Profile Insights?
GBP provides metrics such as photo views, listing actions after visual views, and the number of photos compared with similar businesses; these metrics indicate how visuals contribute to local discovery. Monitor weekly and monthly photo view trends, actions from photos (website clicks, direction requests, phone calls) and changes after new uploads. Correlate GBP visual metrics with booking spikes to determine which images or videos yield the highest local conversion impact.
| GBP Metric | What It Shows | Action Threshold |
|---|---|---|
| Photo Views | How often images are seen on the listing | Increase uploads if steady decline over 4 weeks |
| Actions from Photos | Clicks, calls or directions originating after viewing images | Investigate high-action images for replication |
| Photo Quantity | Number of images compared to competitors | Aim to exceed local average for category |
How to Optimise Visuals for Maximum Patient Engagement on Local Listings?
Optimise GBP and local landing visuals by using descriptive filenames with locality, concise captions that clarify services, consistent clinic branding and regular refresh schedules to signal activity. Compress images for fast loading, include ALT text on website counterparts and monitor GBP photo views after each upload to measure impact. Schedule monthly or quarterly image refreshes and retain consent documentation for patient imagery. Consistent optimisation across listings and site pages increases the likelihood that visual content supports both discovery and conversion.
Milkcan Marketing is positioned as a partner for clinics seeking help measuring and optimising visual content performance; they offer services in content marketing, Google Business Profile management and reputation management to assist with GA4 setup, GBP insights configuration and ROI modelling. Clinics interested in a measurement audit or ROI estimate can enquire about a free audit to identify priority improvements.

